
After weeks of tension, the number one cryptocurrency has taken a significant hit. December has started off deep in the red, with the price of Bitcoin dropping more than 5%. Furthermore, several alarming signals are emerging that are reminiscent of the beginning of previous major market corrections.
A key indicator on the monthly chart has just flashed red. This is a rare occurrence that has historically marked the beginning of a bear market. Analysts are sounding the alarm. But is there still a glimmer of hope for Bitcoin?

Key Indicator Flashes Red for Bitcoin #
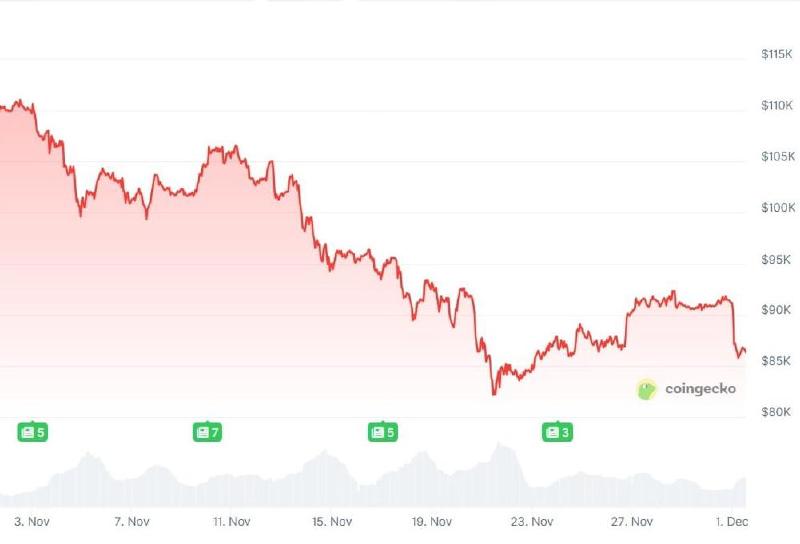
Bitcoin had a positive week, but the end of the weekend also meant the end of the green numbers. Last week, the cryptocurrency still rose by over 4%, but in the past 24 hours, Bitcoin has plummeted by more than 5%. At the time of writing, the world’s largest cryptocurrency is worth $86,781.
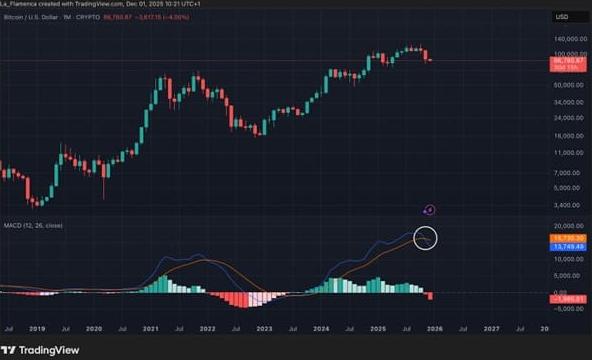
With the recent price drop, an important indicator in Bitcoin’s monthly chart has turned red. This is the Moving Average Convergence Divergence, or MACD for short. Simply put, this indicator measures the momentum and strength of price movements.
The MACD consists of two lines and a histogram, which together predict potential trend directions and provide buy and sell signals. The MACD closed November with both a downward crossover of the lines and a red bar in the histogram. These are bearish (negative) signals.
The MACD is an important indicator, and this bearish signal suggests a broader negative trend. The signal is visible on the monthly price chart, which says something about the longer-term outlook for Bitcoin.
The Last Time This Happened, a Bear Market Began #
It has been years since the MACD on Bitcoin’s monthly chart turned red and the lines crossed each other downwards. The last time this happened was in 2022.
The red MACD is setting off alarm bells because in 2022, it signaled the start of the so-called bear market. This is a period when the price is bearish and declines. This is followed by a bull market, in which prices rise. These two periods alternate in what is called a market cycle.
From the moment the MACD turned red in 2022, the price of Bitcoin collapsed like a house of cards. In one year, the price fell by 60 percent.
December 1, 2025, will also go down in history as a bloody day for the crypto market. This does not mean that the price of Bitcoin will now do the same thing again. The MACD has turned red in Bitcoin’s history more often without always marking the beginning of a bear market.
Past events offer no guarantee for the present. And perhaps that is where the glimmer of hope for the crypto market lies.