
Ethereum has been stuck in a sideways to slightly downward price pattern for some time. The price is currently hovering around $3,000 (approximately €2,500), and the second-largest cryptocurrency is struggling to return to higher levels. Nevertheless, several signals suggest that ethereum is preparing for its next upward rally in this phase.

Photo: Vladimka production/Shutterstock
What the Charts Say About Ethereum #
Ethereum has been slowly losing ground since its peak last month. The price repeatedly gets stuck under an imaginary descending trendline. Simply put, this means that sellers are consistently taking over at higher levels. Additionally, the price is below an important moving average that many traders use to determine whether the crypto market is strong or weak.
Above the current price, there is heavy resistance between €2,800 and €3,060. As long as ethereum does not convincingly close above this, the market remains cautious. On the downside, however, there is an important safety net between €2,210 and €2,125. This is a zone where many buyers were previously active.
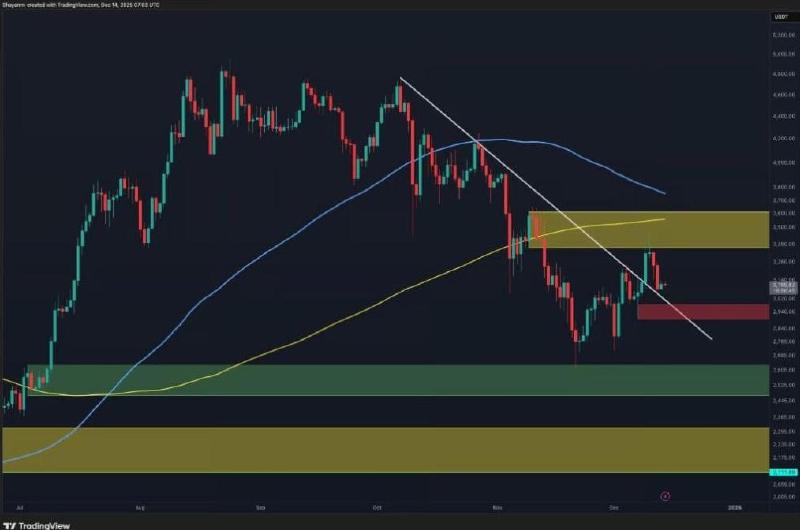
Ethereum price and a notable pattern. Source: TradingView.
This Pattern Keeps the Structure Intact #
On shorter timeframes, crypto analysts are recognizing a pattern often seen during the continuation of an uptrend. This is known as a ‘bull flag’. This pattern forms when the price moves sideways or slightly lower after a previous rise. It is not a sign of weakness, but rather a pause.
For ethereum, this bull flag remains valid as long as the price stays above approximately €2,600. In recent days, the price has fallen back towards this level several times. So far, buyers have intervened each time. This shows that selling pressure is being absorbed and investors are willing to hold on.
Ethereum Data Shows Interesting Developments #
Data from Coinglass shows that many traders in the derivatives market have bet on a decline, especially above the current price. This can impact the further price movement. The long/short ratio stands at 0.9562. This is a metric that compares the number of long positions with the number of short positions. A value lower than one indicates a higher expectation of a price drop, as it means there are more short positions than long positions.
When the ethereum price does move up, these parties may be forced to buy. And that could provide an extra push upwards.
Concretely, this means that ethereum is in a waiting phase. As long as the price remains above €2,600, the picture is stable. A daily close above approximately €2,665 could be the starting signal for a further rise towards €2,880 and possibly later towards €3,400. However, it is not yet that far, as the crypto market is struggling.