
Photo: Konstantin Savusia/Shutterstock
The crypto market showed some strength last week, but most coins are starting this week in the red. Ethereum has fallen sharply since the end of the weekend, and there are signals that the price decline may not be over yet.
Ethereum Price Drops 6% in 24 Hours #
The price of Ethereum started its descent after the weekend. Last week, the price rose by almost 7% and it seemed this weekend that it would reclaim the $3,000 mark. In the past 24 hours, however, the price has suddenly fallen by about 6%.
At the time of writing, Ethereum is worth around $2,840, a price level where the price could theoretically find support. Exactly a week ago, the price also found support at this level. Yet, Ethereum is currently still trading almost 2% higher than a week ago. However, over the past month, the price has fallen by nearly 27%.
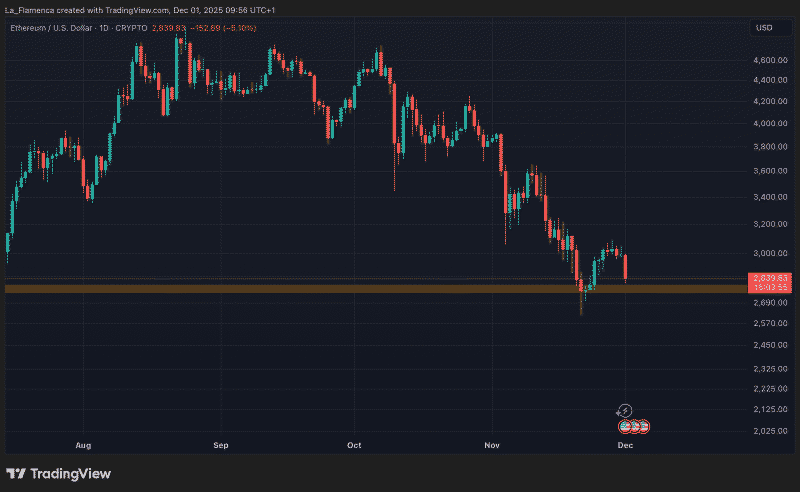
ETH/USD daily price chart with support level. Source: La_Flamenca via TradingView
Bearish Pattern Raises Alarms #
There are signals pointing to a bearish (negative) scenario, where the current price level may not provide enough support for Ethereum. A negative pattern can be seen in the price chart, from which the price has just broken out.
This is the so-called bear flag, a negative flag pattern. With today’s drop, Ethereum has confirmed the pattern, as the price is now below the lower boundary of the flag. A bear flag is often a signal of further price declines.
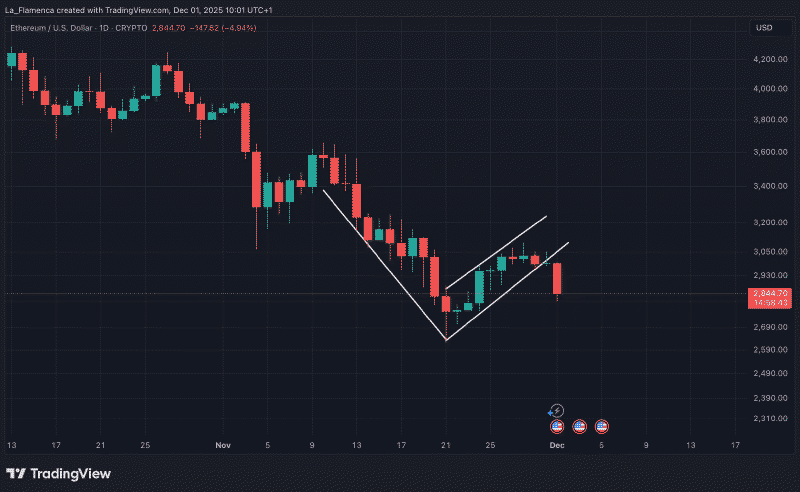
ETH/USD daily price chart with bear flag. Source: La_Flamenca via TradingView
Analyst Expects Price Decline for Ethereum #
Ali Martinez, a well-known technical crypto analyst, is not optimistic. At least, not for the short term. He predicts further price declines. According to the analyst, $2,250, $1,550, and $1,080 are possible price targets for the coin.
The analyst’s prediction is not entirely bearish, because the price drop will, according to him, trigger a new price rally. His price targets are strong price zones where historically a lot of buying has occurred.
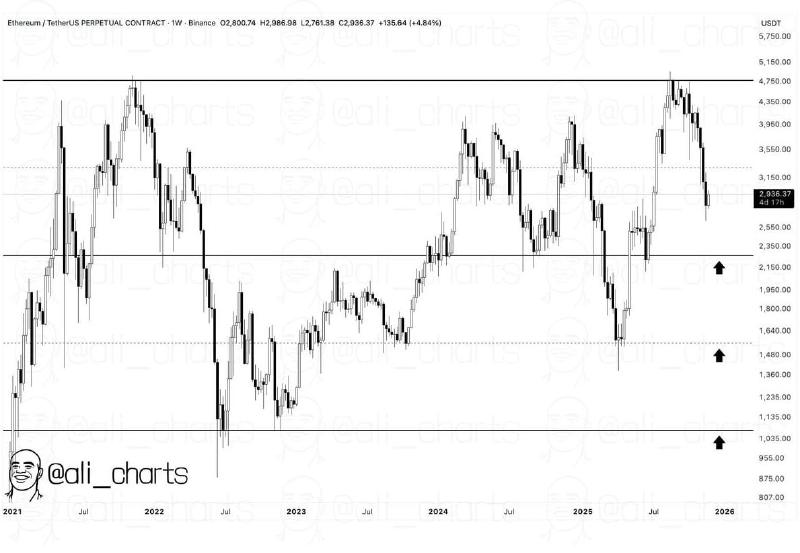
ETH/USD weekly price chart with possible price targets. Source: Ali Charts via X