
XRP has experienced significant price swings this year. After a strong peak in July 2025, the token has been in a clear downtrend, with year-to-date losses reaching as much as 25%. However, according to analysts, technical analyses and market indicators are pointing to potential signs of a recovery.
The Price of XRP #
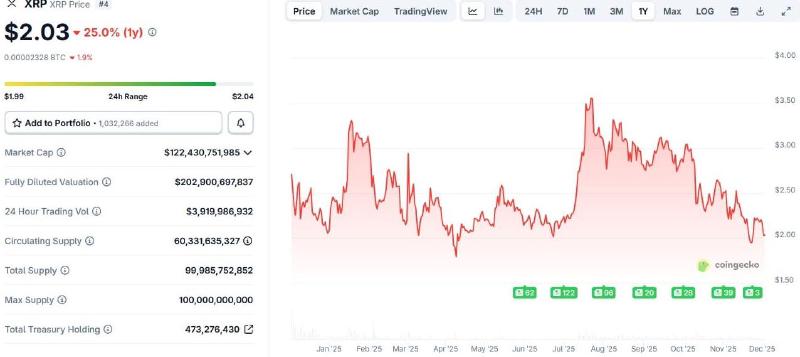
XRP is down 25% this year and has been falling since July. From its all-time high of $3.65 on July 18, 2025, the price has dropped by more than 44%. Today, it’s trading around the same level as yesterday, as the price of Bitcoin has recovered slightly. The token has lost about 7% this week.
Despite the bearish price action, there are positive aspects to note.
Bullish Divergence for XRP #
According to an analysis by ChartNerd on X, XRP has been in a downtrend for over 55 days, following a sharp liquidation event. During this period, XRP has continued to make lower lows, but when looking at the Relative Strength Index (RSI), the analyst observes higher lows. In technical analysis, this is known as bullish divergence. These opposing signals are typically interpreted as a positive sign.
The Relative Strength Index is a straightforward indicator that shows whether a token is overbought or oversold. A reading above 70 indicates it is overbought (a sell signal), while a reading below 30 suggests it is oversold (a buy signal).
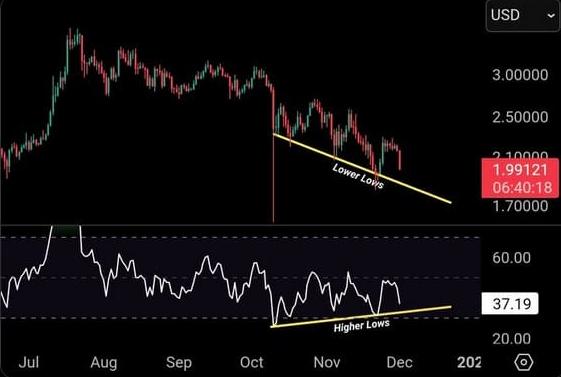
If the price prints lower lows while the RSI prints higher lows, it can mean that the downward momentum is weakening. ChartNerd notes that this signal becomes stronger the longer it persists. However, he also cautions that if the RSI were to start making lower lows, the signal would be invalidated, potentially opening the door for further declines in XRP’s price.
Further Analyses on XRP #
In another analysis, CryptoBull points out that XRP has maintained its position above the 2018 bull market’s monthly high and is still trading well above the $1.75 support level. He argues that this is not the top, claiming that a cycle top is typically characterized by a massive monthly candlestick with high volume—something XRP has yet to produce.
#XRP held above its 2018 bull market monthly highest close for the past 12 months. This is NOT the top. A cycle top is when you have a massive monthly candle with massive volume. We are still waiting for that candle. It will come soon. 🚀🚀🚀 pic.twitter.com/3Bj4MrufDF
— CryptoBull (@CryptoBull2020) December 1, 2025
According to a separate analysis by EGRAG CRYPTO, XRP is now trading above its 50-month exponential moving average (EMA), which acted as strong resistance throughout 2021. He believes there is a good chance of an XRP breakout in the next 3 to 6 months. He sees a bullish flag pattern forming on his chart and thinks the XRP price has a more than 50% chance of breaking out against Bitcoin.