
The price of XRP has dropped sharply by about 6.5% in the last 24 hours, falling to approximately $2. This decline was paired with a surge in trading activity. Despite the drop, one analyst suggests the price is forming a notably positive pattern similar to its 2017 price action, when XRP’s value surged by over 7,000%.
In Short #
- The price of XRP has fallen to about $2.05, a 6.5% drop in 24 hours.
- The drop occurred during a period of very high trading activity, which increased by over 90%.
- Analysts consider the $2 level an important psychological support zone for the price.
XRP Price Drops After Stable Period #
The recent price drop for XRP follows a period of relative stability. The price had been hovering around $2.20 for some time, a level traders viewed as a resistance zone where selling pressure often increases, making further gains more difficult.
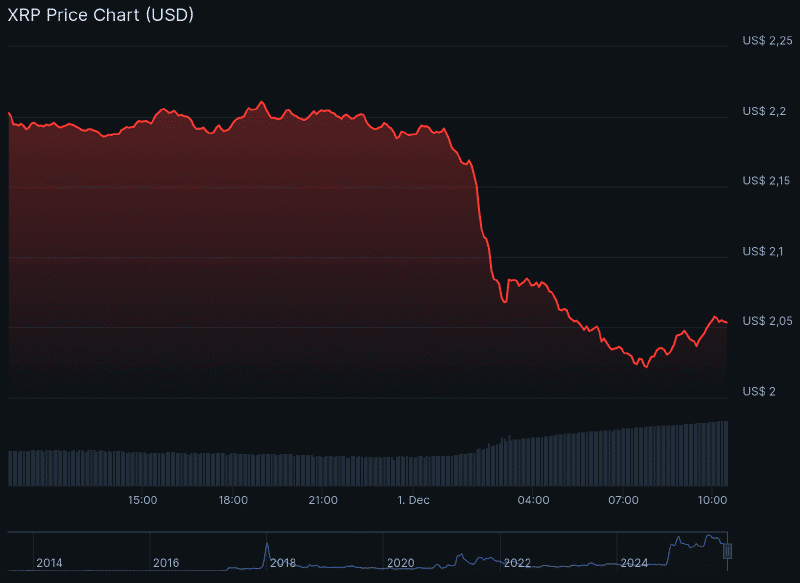
At the same time, trading activity increased significantly. Trading volume rose by more than 92% in 24 hours to $3.84 billion, indicating a very high number of transactions on major crypto exchanges during the price fall.
Analysts Watch the $2 Support Level #
The current price of XRP is sitting just above the $2 mark, a so-called psychological level. These are round numbers where investors often base their buy or sell decisions, making them significant for price action.
The buy wall for $XRP exist since $2 — CW (@CW8900) December 1, 2025
Analysts, such as CW8900 on X, point out that this level appears to be functioning as a key support zone. This can be seen as a floor where many buy orders are waiting, which could slow down any further decline. On charts, this phenomenon is also known as a ‘buy wall’.
2017 Comparison Fuels Ripple (XRP) Speculation #
On X, analyses are also circulating that compare XRP’s current price chart to a pattern from 2017. Back then, a very similar price structure was followed by an extremely strong rally of more than 7,400%.
HISTORY IS REPEATING $XRP is following 2017 pattern. Same chart. Same structure. Same ALL. Do NOT say I didn’t warn you… — Crypto Currency (@Crypto0637) November 30, 2025
Such technical analyses are based on the assumption that historical patterns can repeat themselves. However, this is speculative and offers no guarantee for future results. The crypto market is known for its volatility, where prices can move quickly and unpredictably.
Recently, there was still positive XRP news to report. Several new XRP exchange-traded funds (ETFs) entered traditional stock exchanges on Wall Street. Today, another new XRP ETF is also launching.